- Video mobile automation
- Quality benchmarking
- Remote device control
What is the best OTT video mobile app in the United Kingdom?
By Witbe
Introduction & setup
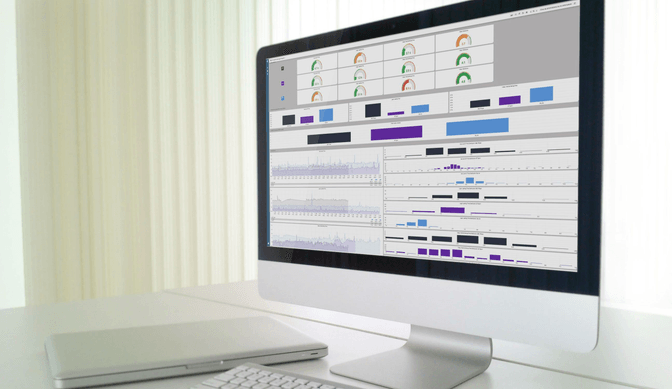
The environment for this Snapshot consisted of a Witbe “Video & Media” Mini Robot hosted in the Witbe London Office and connected to an iPhone 8 running iOS 12.1. The iPhone 8 was chosen because it is the most sold iPhone device of 2018.
The three UK OTT video streaming apps tested were: BBC iPlayer, BT Sport, and Sky Go.
The internet service provider was BT “Superfast Fibre 2 Unlimited” with 76 Mbps downloads speed.
We measured and verified the following KPIs:
- App Launch Time: time between the Robot clicking on the app icon and the app being ready to be used (the apps are “force-closed” after every run)
- Login Time: time between the Robot clicking on the login button (after credentials were input) and it being successfully logged-in (the apps are logged-out before every run)
- Video Initial Buffering Time: time between the Robot clicking on the play button and the video starting to play
- Witbe VQ-MOS Score: a score representing the video quality of the first 2 minutes of video, measured with our famous Video Quality Mean Opinion Score algorithm
The KPIs were measured every 30 minutes on every app, over a 72-hour period, from Friday November 23rd to Monday November 26th 2018, for a total of more than 100 viewing sess
All graphs and other visual representations of KPIs in this QoE Snapshot are generated with Witbe Datalab, our new restitution interface for fault finding, root cause analysis and advanced analytics.
Global Overview
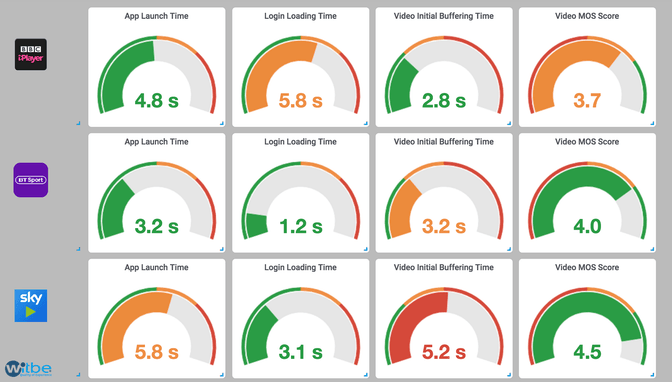
First let’s look at the overall performance. All three apps have decent Launch Time, under 6s. Login Time is acceptable considering that customers are rarely logged out, even if 5s may seem a bit high.
We also note that the fastest Video Initial Buffering Time has the lowest Witbe VQ-MOS score and the slowest Video Initial Buffering Time has the highest Witbe VQ-MOS score. This highlights particularly well the struggle OTT video mobile app’s engineers face when balancing load times and video quality.
Customers in the United Kingdom appear to be benefitting from an overall satisfactory video viewing experience on mobile devices.
Focus on Prime Time
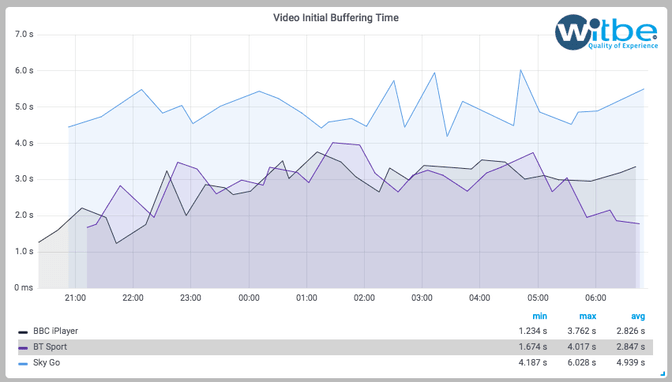
This 2nd graph shows the Initial Buffering Time KPI over time for each app between 8pm and 7am on November 24th 2018.
We can see that, at 8pm, when TV prime time starts, the Initial Buffering Time of the 2 fastest apps (BBC iPlayer and BT Sport) begins to slowly increase, and reaches its peak at 1am (2.5 to 3 times worst compared to optimal conditions). On the other hand, Sky Go who has the slowest Initial Buffering Time is the least impacted by the increase in load.
This raises the question if it is preferable to have slower loading times that are more stable over time or simply faster with more ups and downs.
Another way to look at Initial Buffering Time
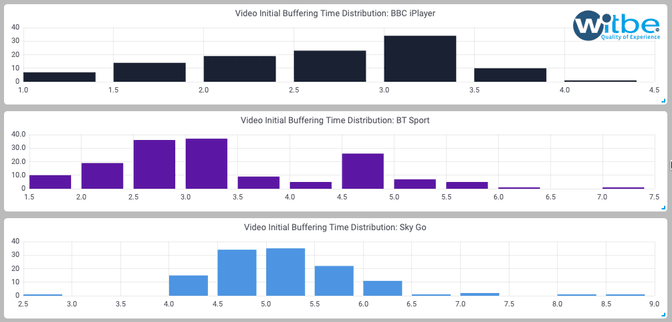
This last analysis is for the data nerds among us. These graphs represent the distribution of the Initial Buffering Time KPI by buckets of 500ms.
We can see that Sky Go and BBC iPlayer have gaussian distributions. However, BT Sport has a significant peak at 4.5s, way outside its 2.5s gaussian. In other words, even if BT Sport has the fastest Initial Buffering Time, for 20% of its viewing sessions the Initial Buffering Time is almost as slow as the slowest app.
By identifying the root cause of this peak, BT Sport engineers would have what they need to improve the quality of the anomalous viewing sessions and become first in Initial Buffering Time for 100% of viewing sessions.
Conclusion
To conclude, the most consistent OTT video mobile app in the UK seems to be BT Sport, but in terms of video quality Sky Go is the winner at the price of longer loading times.
We also note that the lowest median Witbe VQ-MOS score measured in this QoE Snapshot is 3.8. Based on our expertise, the overall video quality appears to be increasing over the years, highlighting the heavy investments of the industry in this domain. Finally, as we said before, customers in the United Kingdom benefit from an overall satisfactory video viewing experience on mobile devices.
For more details about the results of this QoE Snapshot, don't hesitate to contact us!
About Witbe QoE Snapshots
In the same way that a consumer report tests a product and publishes an analysis of its overall quality, the Witbe QoE Snapshots test digital services to make available to the market information on the true Quality of Experience delivered internationally. These QoE Snapshots should not serve as benchmarks nor as rankings of operators by service or by device. Rather, the goal of these QoE Snapshots is to provide a global overview of digital services with multiple configurations, and in various environments. The public will thus be able to better understand the technological complexity inherent to today’s services, like the distribution of video content. It is quite a technical feat – considering the efforts and means implemented – to broadcast videos on different devices and networks, with a quality that is acceptable by consumers with high expectations.
Since its origin, Witbe relies on a non-intrusive technology, based on Robots measuring the quality truly delivered. The Witbe Robots are placed at the edge of distribution, and connected to test devices, the same ones as those used by real users. The Robots measure the Quality of Experience actually delivered to the end-users by providing KPIs on the availability, performance and integrity of the service.
Each snapshot is composed of several analytical frames, highlighting interesting findings about the KPIs that were measured. For its first QoE Snapshot, Witbe is publishing a look at the quality of OTT video mobile app in the United Kingdom: BBC iPlayer, BT Sport, and Sky Go.
